Free dataset · CC BY 4.0
Business sale multiples
by industry.

 Reviewed by Rob Ismoilov · M&A Advisor
Across 9 categories.
Personal services floor to pest-control ceiling.
Same P25-P75 methodology across verticals.
Engagement letter → funding wire.
Downloads
Three formats. One source of truth.
All three formats derive from the same underlying data module. Update once, they all update together.
CSV
22 rows · UTF-8
Direct import into Excel, Google Sheets, or your analytics stack. Includes source-citation column per row.
Content-Type: text/csv
JSON
RFC 8259 · pretty-printed
Machine-readable dataset with metadata block (version, license, sources). Content-type application/json.
Content-Type: application/json
SVG infographic
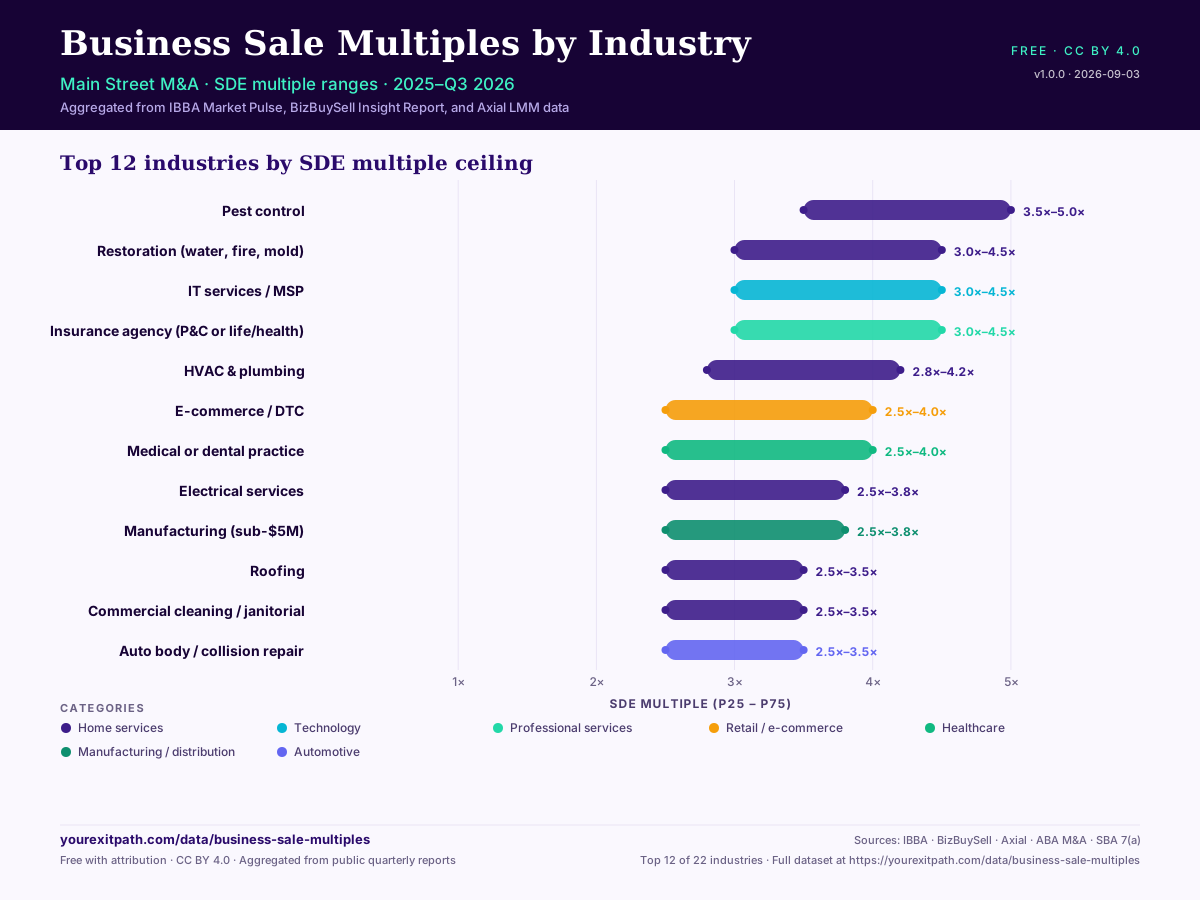
1200 × 900 · embeddable
Chart-style visualization suitable for embedding on any page. Includes yourexitpath.com attribution in the SVG itself.
Content-Type: image/svg+xml
Embed the infographic in one line:
<a href="https://yourexitpath.com/data/business-sale-multiples"><img src="https://yourexitpath.com/data/business-sale-multiples/infographic.svg" alt="Main Street business sale multiples by industry" width="1200" height="900" /></a>
22 rows across 9 categories
The full dataset.
Multiples reflect P25-P75 bands aggregated across the sources cited in each row. Ranges assume clean books, three years of accrual-basis financials, and no material owner-dependency concentration.
Home services
| Industry | SDE multiple | EBITDA multiple | Days to close | Primary buyer | Sources |
|---|---|---|---|---|---|
HVAC & plumbing Recurring maintenance-agreement penetration above ~40% pushes into the top of the range. | 2.8×–4.2× | 5.0×–8.0× | 180–240 | PE-backed roll-up platform | ibbabizbuysellaxialpreqin |
Electrical services Commercial-contract mix (vs residential-only) and licensed-electrician bench depth. | 2.5×–3.8× | 4.5×–6.5× | 180–240 | PE-backed roll-up + regional strategic | ibbabizbuysellaxial |
Roofing Insurance-carrier direct-repair relationships + repeat-inspection revenue mix. | 2.5×–3.5× | 4.5×–6.0× | 150–210 | PE-backed platform + strategic consolidator | ibbabizbuysell |
Landscaping & lawn care Commercial-contract mix > 50% pushes multiples up; residential-only clusters lower. | 2.2×–3.5× | 4.0×–6.0× | 180–240 | PE-backed roll-up + regional strategic | ibbabizbuysellaxial |
Pest control Recurring service contract percentage — the highest-multiple home-services vertical. | 3.5×–5.0× | 6.0×–9.0× | 150–210 | PE-backed pest platform (Rentokil, Terminix, Aptive) | ibbabizbuysellaxialpreqin |
Restoration (water, fire, mold) Insurance-carrier TPA panel status materially raises the multiple. | 3.0×–4.5× | 5.5×–8.5× | 180–210 | Strategic consolidator + PE platform | ibbabizbuysellaxial |
Commercial cleaning / janitorial Contract length + concentration risk of top customers. | 2.5×–3.5× | 4.0×–6.0× | 150–210 | Regional strategic + PE roll-up | ibbabizbuysell |
Automotive
| Industry | SDE multiple | EBITDA multiple | Days to close | Primary buyer | Sources |
|---|---|---|---|---|---|
Auto repair / service Real-estate ownership significantly changes the enterprise-value calculation. | 2.0×–3.0× | 3.5×–5.0× | 150–210 | Individual operator + regional multi-shop group | ibbabizbuysell |
Auto body / collision repair Insurance-carrier DRP status is the primary multiple lever. | 2.5×–3.5× | 4.0×–6.0× | 150–210 | PE-backed MSO consolidator + regional strategic | ibbabizbuysellaxial |
Manufacturing / distribution
| Industry | SDE multiple | EBITDA multiple | Days to close | Primary buyer | Sources |
|---|---|---|---|---|---|
Manufacturing (sub-$5M) Customer concentration < 25% + documented processes are the two biggest multiple movers. | 2.5×–3.8× | 4.5×–6.5× | 210–300 | Search fund + strategic acquirer | ibbabizbuysellaba-deal-point |
Distribution / wholesale Exclusive supplier agreements + working-capital efficiency. | 2.3×–3.5× | 4.0×–6.0× | 180–270 | Strategic (upstream or adjacent) | ibbabizbuysell |
Food service
| Industry | SDE multiple | EBITDA multiple | Days to close | Primary buyer | Sources |
|---|---|---|---|---|---|
Restaurant (independent) Real-estate ownership + brand recognition; SBA-financed asset sales dominate. | 1.5×–2.5× | 3.0×–4.5× | 150–210 | Individual operator + small restaurant group | ibbabizbuysellsba-7a |
Restaurant (franchise unit) Franchisor consent + territory rights + remaining franchise-term length. | 2.0×–3.0× | 3.5×–5.0× | 180–240 | Existing franchisee + multi-unit operator | ibbabizbuysell |
Retail / e-commerce
| Industry | SDE multiple | EBITDA multiple | Days to close | Primary buyer | Sources |
|---|---|---|---|---|---|
Retail (independent brick-and-mortar) Lease assignability + inventory turnover + local competitive dynamics. | 1.8×–2.8× | 3.0×–4.5× | 150–210 | Individual operator + small local group | ibbabizbuysell |
E-commerce / DTC Platform concentration risk (single-marketplace dependency) is the biggest discount lever. | 2.5×–4.0× | 4.0×–7.0× | 120–180 | Aggregator + strategic acquirer | ibbabizbuysellaxial |
Technology
| Industry | SDE multiple | EBITDA multiple | Days to close | Primary buyer | Sources |
|---|---|---|---|---|---|
IT services / MSP MRR > 60% of revenue is the single biggest driver of top-of-range pricing. | 3.0×–4.5× | 5.5×–9.0× | 180–240 | PE-backed MSP platform | ibbabizbuysellaxialpreqin |
Professional services
| Industry | SDE multiple | EBITDA multiple | Days to close | Primary buyer | Sources |
|---|---|---|---|---|---|
Accounting / bookkeeping Client retention + practice specialization (tax, advisory, forensic) drives ranges. | 2.5×–3.5× | 4.5×–6.5× | 150–240 | Adjacent firm + PE-backed accounting consolidator | ibbabizbuysellaxial |
Insurance agency (P&C or life/health) Book renewal retention rate — top-decile agencies clear multi-year retention > 92%. | 3.0×–4.5× | 6.0×–9.0× | 150–240 | PE-backed insurance broker consolidator | ibbabizbuysellaxialpreqin |
Law firm (small) Individual attorney dependence — highest multiple when work is process-driven vs relationship-driven. | 1.5×–2.5× | 3.0×–4.5× | 180–300 | Merger with regional firm + succession-based buyout | ibbabizbuysell |
Marketing / creative agency Recurring retainer revenue mix + client tenure distribution. | 2.5×–3.5× | 4.5×–6.5× | 180–240 | Holding company + adjacent-specialty strategic + search fund | ibbabizbuysellaxial |
Personal services
| Industry | SDE multiple | EBITDA multiple | Days to close | Primary buyer | Sources |
|---|---|---|---|---|---|
Salon / fitness / personal services Owner-operator dependency is the primary discount driver at Main Street scale. | 1.5×–2.5× | 3.0×–4.5× | 150–210 | Individual operator + regional franchise group | ibbabizbuysell |
Healthcare
| Industry | SDE multiple | EBITDA multiple | Days to close | Primary buyer | Sources |
|---|---|---|---|---|---|
Medical or dental practice Insurance-provider network status + associate-doctor tenure + state licensing regime. | 2.5×–4.0× | 5.0×–7.0× | 210–300 | PE-backed practice-management platform (DSO / MSO) | ibbabizbuysellaxialpreqin |
SDE (Seller's Discretionary Earnings) applies to businesses with sub-$1M in cash flow. EBITDA is standard above $1M. Ranges reflect typical P25-P75 across public quarterly reports 2025-Q3 2026. Source badges: IBBA = IBBA Market Pulse, BIZBUYSELL = BizBuySell Insight Report, AXIAL = Axial Behavioral Index, ABA-DEAL-POINT = ABA M&A Committee Deal Point Studies, SBA-7A = SBA 7(a) Loan Program public data, PREQIN = Preqin private-capital data.
Methodology + license
How we compiled this.
Aggregation approach
Ranges represent typical P25–P75 bands aggregated across public quarterly reports (IBBA Market Pulse, BizBuySell Insight Report) for the 2025–Q3 2026 window in the Main Street sub-$5M-revenue segment. This is a synthesis of publicly-available industry data, not proprietary research. Every row declares which primary sources most directly cover its data via the `sources` field. Multiples assume clean books, three years of accrual-basis financials, and no material owner-dependency concentration.
Scope. United States. Main Street private-target M&A (roughly sub-$5M revenue). Excludes cross-border deals, distressed sales, and public-company acquisitions.
Free with attribution
Licensed under Creative Commons Attribution 4.0 International. Use, adapt, and republish in any format — commercial or otherwise — with attribution back to Your Exit Path.
Cite as
Main Street M&A Benchmarks (Your Exit Path, 2026). Retrieved from https://yourexitpath.com/data/business-sale-multiples. Licensed CC BY 4.0.
Topic cluster
Business Valuation
How buyers actually price Main Street businesses — SDE and EBITDA multiples, industry benchmarks, and the eight factors that move the number.
Also in this cluster · 7 pages
Free exit calculator
Industry-calibrated valuation range in 5 minutes with no signup required.
Buyer Demand Index
0-100 composite Buyer Demand Score for 150 (metro × industry) tuples across the top 25 U.S. metros and six Main Street industries. Free CC BY 4.0 with CSV / JSON / SVG downloads.
Predict My Buyer
Interactive probability model across the five Main Street buyer types (Individual, Strategic, Search Fund, PE Consolidator, PE Platform). Live results with per-factor transparency.
Sellability score
Score across the five factors buyers actually diligence — financials, management, concentration, structure, dependence.
Net proceeds waterfall
Headline price → cash at close after taxes, fees, and seller-note timing.
Market-wide multiple benchmarks
P25–P75 SDE and EBITDA ranges by industry, sourced from IBBA + BizBuySell.
Industry-specific multiples
Per-vertical valuation multiples, active buyers, and exit playbooks across 200+ Main Street industries.
Your industry, your number
Apply these multiples to your business.
The free Exit Calculator runs your SDE / EBITDA through the same industry multiples above and returns a valuation range plus a five-factor readiness score. Five minutes, no signup.