Free dataset · CC BY 4.0
The silver tsunami,
state by state.

 Reviewed by Rob Ismoilov · M&A Advisor
United States · roll-up
The scale of the transition.
About 51% of U.S. employer businesses are owned by someone age 55 or older. Applying a 35% assumed market-transition rate (per EPI's State of Owner Readiness) to typical Main Street enterprise values of $250K–$750K yields the ranges below.
With paid employees. Census SUSB 2022.
50.5% of the U.S. total.
Range across 51 rows. Point estimates avoided.
ABS 2022 direct measurement vs. Census-population interpolation.
Interactive map · hover or tap any state
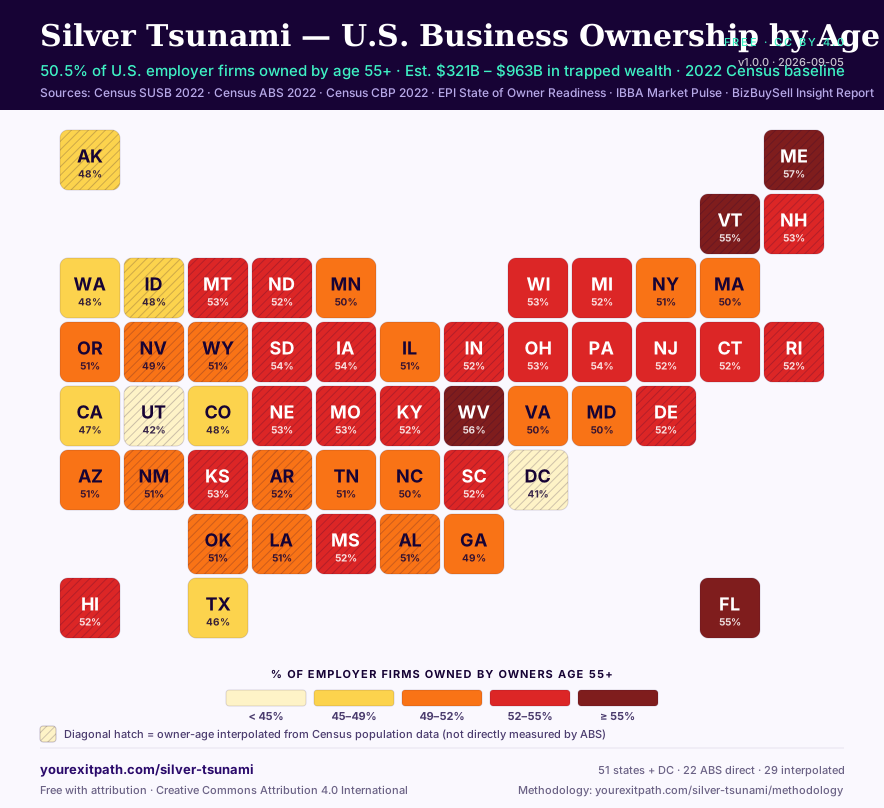
U.S. business ownership by age.
Every state is a tile of equal size — a Rhode-Island-sized square doesn't disappear next to Texas the way it would on a geographic outline. Tiles are colour-fill-encoded by the percent of the state's employer firms owned by owners 55+. Diagonal hatch marks the 29 states with interpolated owner-age numbers.
Hover a state to preview. Click to hold the selection. Diagonal hatch marks the 29 states where owner-age percent is interpolated from Census population data rather than directly measured by ABS.
Headline rankings
Where the transition is concentrated.
Largest boomer-owned business populations
By total number of firms owned by age 55+
- 1423,000 firmsCalifornia$37.0B – $111.0B est. trapped wealth
- 2305,300 firmsFlorida$26.7B – $80.1B est. trapped wealth
- 3255,300 firmsTexas$22.3B – $67.0B est. trapped wealth
- 4255,000 firmsNew York$22.3B – $66.9B est. trapped wealth
- 5140,400 firmsPennsylvania$12.3B – $36.9B est. trapped wealth
Highest boomer-ownership concentration
By share of employer firms owned by age 55+
- 157.0%Maine22,800 firms · interpolated
- 256.0%West Virginia19,600 firms · interpolated
- 355.0%Vermont12,100 firms · interpolated
- 455.0%Florida305,300 firms · ABS direct
- 554.0%Pennsylvania140,400 firms · ABS direct
Downloads
Three formats. One source of truth.
All three formats derive from the same underlying data module. Update once, they all update together.
CSV
51 rows · UTF-8
Direct import into Excel, Google Sheets, or your analytics stack. Includes source-citation column and per-row interpolation flag.
Content-Type: text/csv
JSON
RFC 8259 · pretty-printed
Machine-readable Dataset with in-band metadata (version, license, sources) so agents can verify provenance without a second fetch.
Content-Type: application/json
SVG map
Embeddable tile grid
Static (non-interactive) version of the tile-grid map. Suitable for news articles, LinkedIn posts, and PDF reports. Includes yourexitpath.com attribution in-image.
Content-Type: image/svg+xml
Embed the map in one line:
<a href="https://yourexitpath.com/silver-tsunami"><img src="https://yourexitpath.com/silver-tsunami/map.svg" alt="Silver Tsunami — U.S. business ownership by age" width="800" height="640" /></a>
Methodology + license
What's measured, what's estimated.
Two kinds of numbers on this page: directly-measured Census counts, and derived estimates that we publish as ranges rather than point figures. The full formula, per- state confidence bands, and source URLs live on the methodology page.
What is measured directly
- · Total employer firms per state — U.S. Census Bureau Statistics of U.S. Businesses (SUSB) 2022.
- · Owner-age percent (55+ and 65+) for 22 states — U.S. Census Bureau Annual Business Survey (ABS) 2022 direct measurement.
- · Top industry per state — Census County Business Patterns (CBP) 2022.
What is estimated (as ranges)
- · Owner-age percent for 29 interpolated states — derived from Census population age × ABS national owner-age correlation. Marked with diagonal hatch on the map and flagged per-row in the CSV / JSON.
- · Trapped-wealth ranges — boomer-owned firms × 35% assumed transition rate × $250K–$750K typical Main Street enterprise value. Reported as low-to-high range — never a point figure.
Licensed under Creative Commons Attribution 4.0 International. Use, adapt, and republish in any format — commercial or otherwise — with attribution back to yourexitpath.com/silver-tsunami.
Cite as
Silver Tsunami State Business Ownership Dataset (Your Exit Path, 2026). Retrieved from https://yourexitpath.com/silver-tsunami. Licensed CC BY 4.0.
Topic cluster
How to Sell a Business
The seller's playbook — from the decision to sell through choosing a broker, negotiating LOI, and closing.
Also in this cluster · 9 pages
Seller registration
Create a private seller account in under 60 seconds. Anti-spam gated by a 6-digit email code.
10-step sales process
What actually happens between decision-to-sell and closing — 9-12 month timeline, deliverables per step.
24-month pre-sale readiness
The prep window that materially moves your exit valuation — books, KPIs, concentration, management depth.
Sold businesses — market data
Median SDE and EBITDA multiples by industry, days-to-close, and buyer-type mix.
When should I sell my business?
The four signals that tell you the timing is right, and the three that mean waiting is more valuable.
How long does selling a business take?
9-12 months is typical. Here's what each phase eats and where deals actually stall.
Business sale timeline dataset
Phase-by-phase duration bands segmented by preparation quality. Free CC BY 4.0 with CSV / JSON / SVG downloads.
Seller FAQ
20 questions every first-time Main Street seller asks about brokers, valuation, taxes, and confidentiality.
How much is my business worth?
Free, 5-minute, industry-calibrated valuation range plus Exit Readiness Score.
Your state, your number
See what your business is worth today.
If you're one of the millions of owners in the 55+ cohort thinking about the next five years, the readiness score matters more than the map. Five minutes, no signup, real numbers.